Analysis of Temperature Trends and the Effects of Climate Change in
Sicily
Climate is the average condition of weather at a particular location over a relatively long
period of time, ranging from
months to thousands of years. Its features is mainly exhibited by a set of relevant parameters
(such as temperature,
wind velocity, humidity and precipitation) collected over a multiple temporal and spatial
scales. The numerical values
of those parameters are the outcome of synergistic processes that happen in several complex (and
interacting) systems,
including the Atmosphere, Hydrosphere, Cryosphere, Lithosphere, Biosphere, and Anthroposphere.
In our study we analyze
meteorological data from three weather Stations located in Sicily using a historical dataset
spanning the period
1983–2024, aiming to identify long-term trends and seasonal variations of temperature using
various classical and
innovative statistical methods confirming its alignment with global climate change. To identify
possible temperature
trends, an ordinary least squares linear regression model was applied to the annual maximum,
minimum and mean
temperature series. This test is more effective than a non-parametric test but the errors are
assumed to be independent
and identically distributed. Furthermore, non -parametric Mann-Kendall test and Sen's slope
analysis (which demonstrate
greater robustness against extreme values) were applied to detect monotonic trend patterns. The
Innovative Trend
Analysis (ITA) approach was also employed, providing a novel visual methodology for examining
fluctuations and possible
trends in chronological time series datasets.
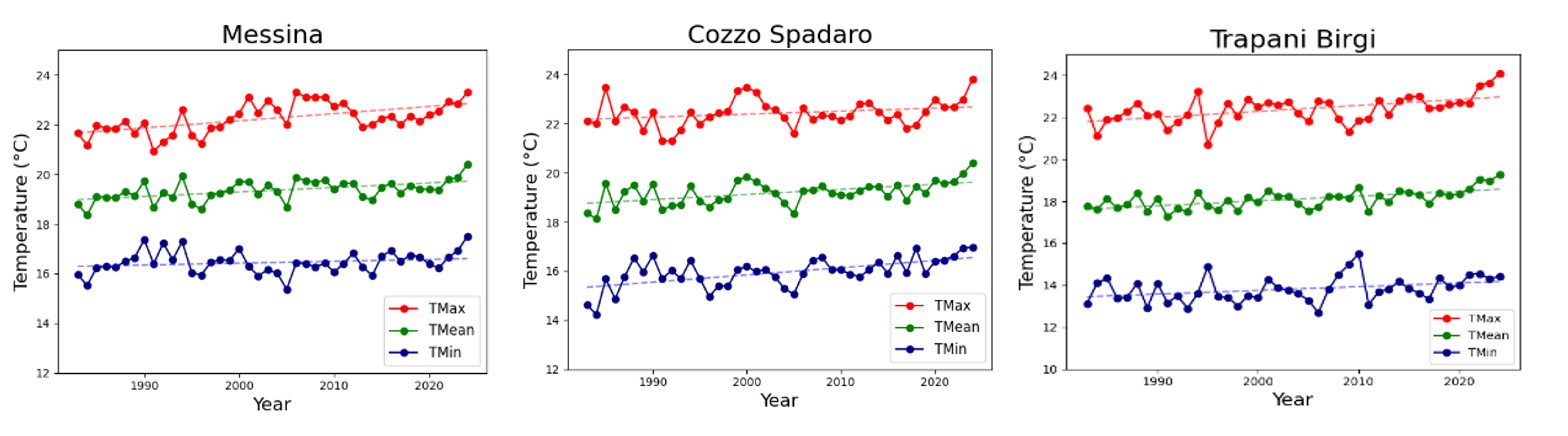
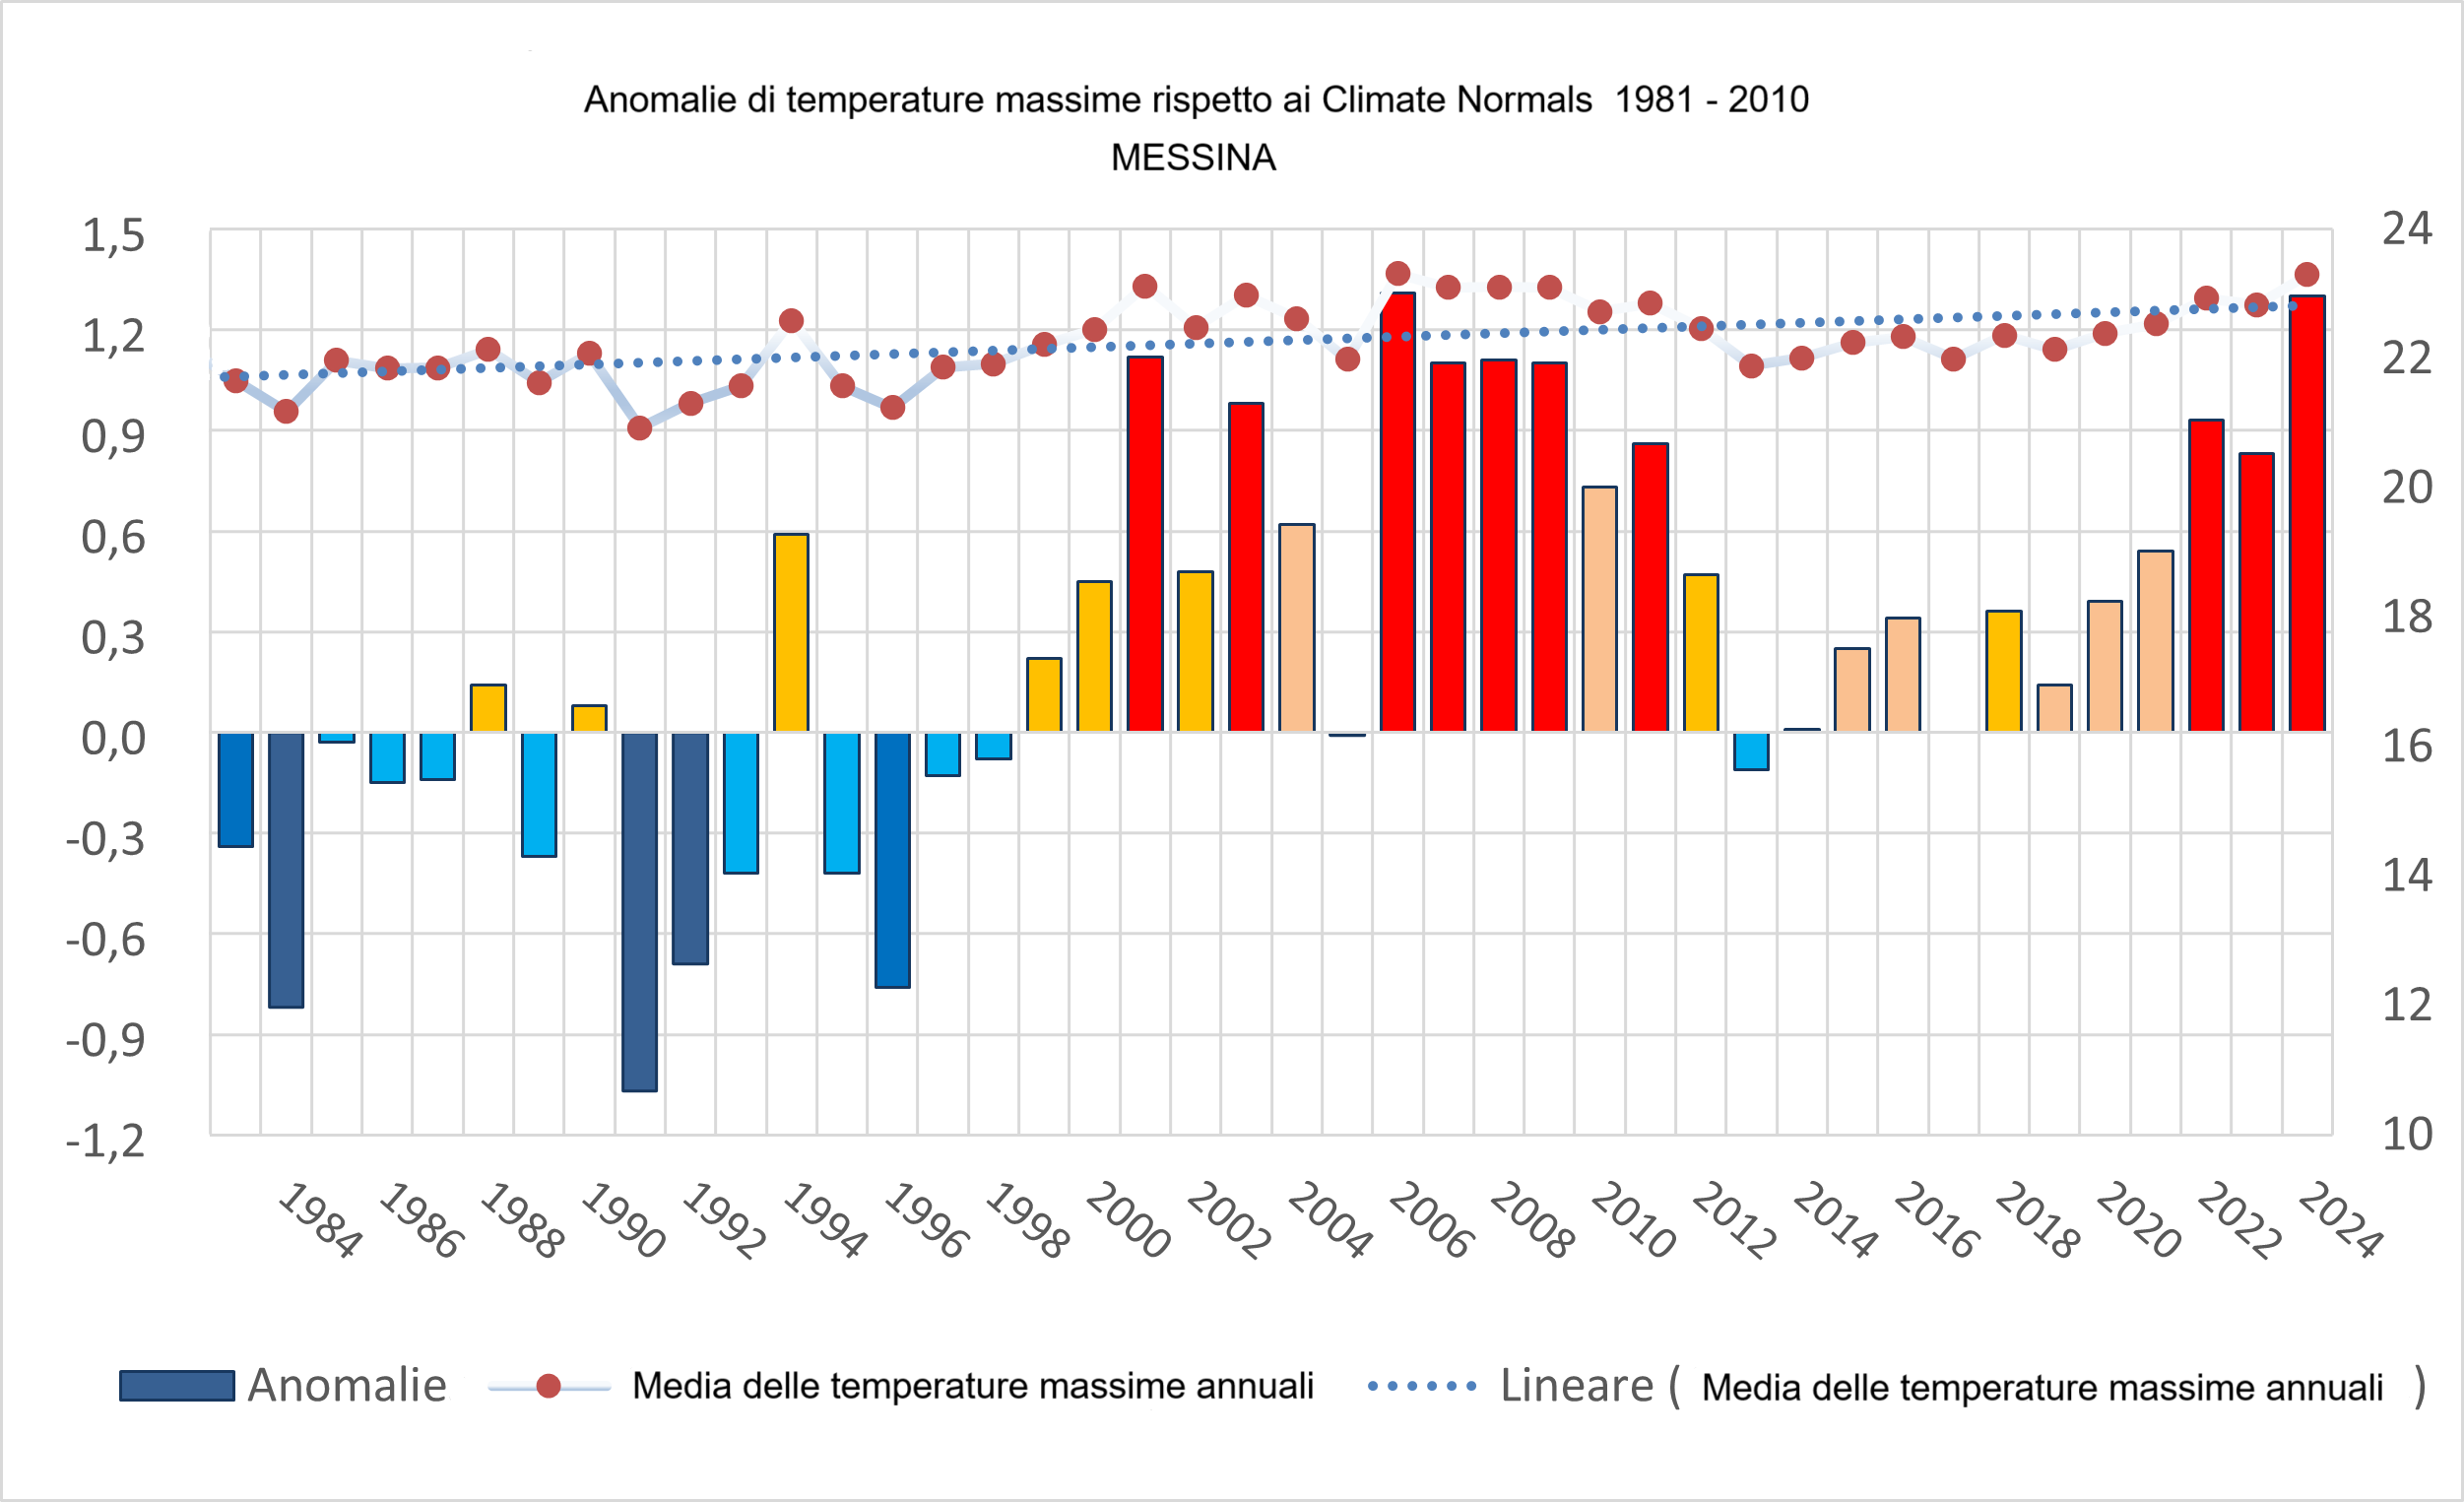
Our analysis of annual temperatures over a period of 42 years highlighted a significant trend of
increase over time. The
results indicate a moderate but constant rate of increase with few substantial differences
between the weather stations
analyzed over the considered period with an increase of about 0.024 °C/year for maximum
temperatures, 0.019 °C/year for
minimum temperatures, and an average increase of about 0.021 °C/year, which translates into an
average temperature
increase of +0.9 °C.
These results are quite consistent with warming at the Global, European and National levels. In
fact, from the
pre-industrial period (1850–1900) to 2024, the earth's average temperature has elevated by
nearly +1.34 °C. 2024 became
the warmest year in recorded history,displaying a global mean temperature around +1,55°C ±
0,13°C higher than pre-industrial periods.
___Giuseppe Collorà, Maria Teresa Caccamo,
Salvatore Magazù
References
Intergovernmental Panel on Climate Change, (2023). Climate Change 2021:
The Physical Science
Basis. Contribution of
Working Group I to the Sixth Assessment Report of the Intergovernmental Panel on Climate
Change. Cambridge:
Cambridge
University Press.
“Clima 2023, la Sicilia è nella morsa del cambiamento climatico”, (2024).
RisorgimentoSicilia (online)
“I cambiamenti climatici in Sicilia. L'isola tra siccità, bombe d'acqua e
desertificazione”, (2021). Tp24 (online)
___
___